SNMP Statistics Dashboard View
Last Updated: September 25, 2026
View aggregated printer metrics for any part of your fleet from the Statistics tab in the Admin Console.
Requirements
Review the Requirements for the SNMP Statistics Dashboard before you begin.
View Statistics
- Sign in to the Admin Console.
- In the tree structure, select the folder you want to view. To view your entire fleet, select the root folder.
- Select the Statistics tab.
- Review the metrics for the selected folder and its subfolders.
To view a different part of your fleet, select another folder in the tree structure.
SNMP Status Reports
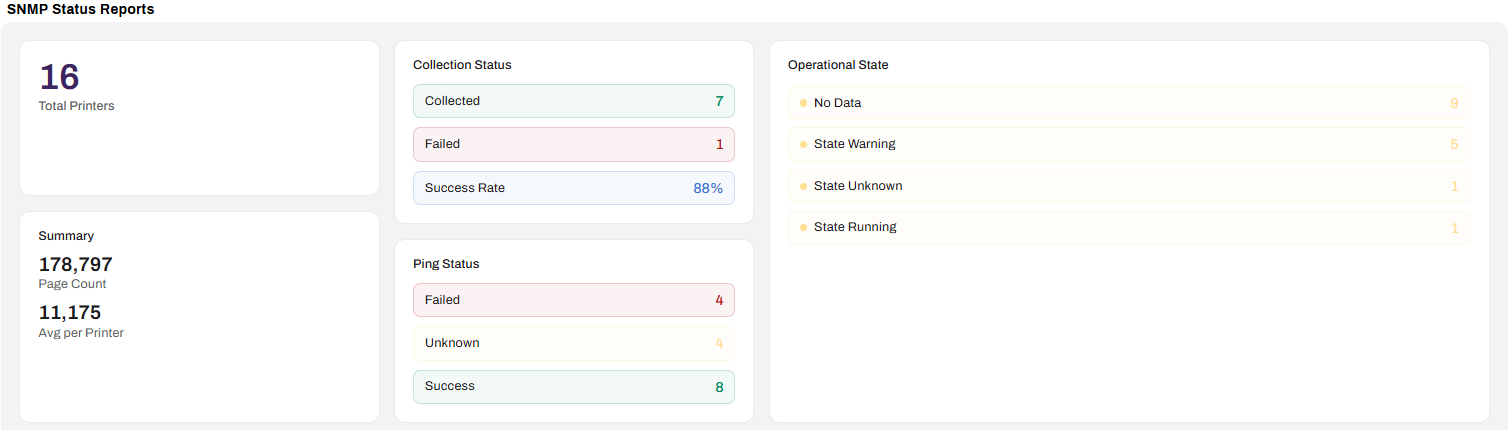
This section gives you a fleet-wide snapshot of your printers' monitoring health, including:
- Total Printers
- Shows the printer count in the selected folder scope.
- Summary
- Displays the combined page count across those printers along with the average page count per printer.
- Collection Status
- Reports how many printers PrinterLogic successfully polls for SNMP data compared to how many fail, along with an overall success rate.
- Ping Status
- Shows network reachability results for the same printers, such as Success, Failed, or Unknown.
- Operational State
- Groups printers by their current SNMP-reported condition, such as Running, Warning, Unknown, or No Data.
Data Freshness by Time Window
This section shows how current your SNMP status and operational state data is, because PrinterLogic collects this data on an ongoing basis rather than in real time. Printers group into four freshness bands based on the age of their most recent successful collection:
- Fresh
- 0-30 minutes.
- Recent
- 30 minutes-2 hours.
- Aging
- 2-6 hours.
- Stale
- 6+ hours.
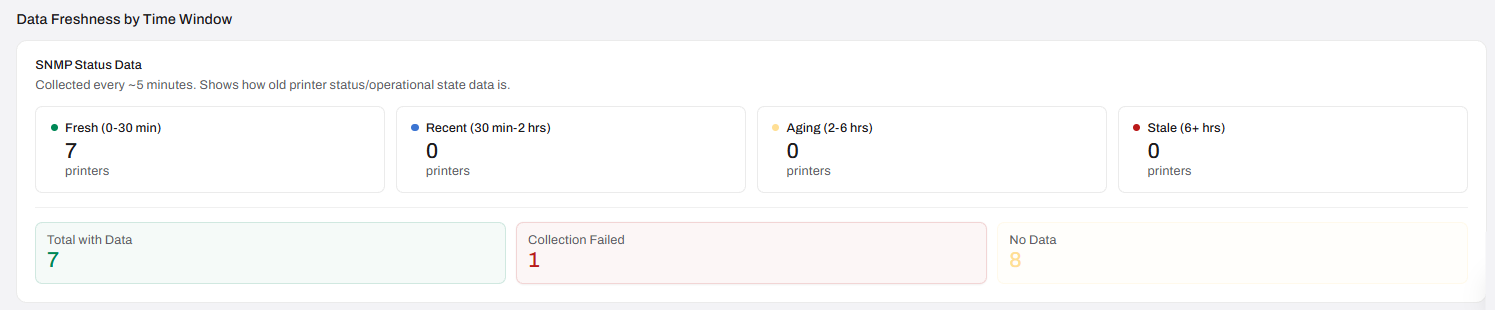
Below the bands, you can also see the total number of printers with usable data, the number of printers where the most recent collection attempt failed, and the number of printers with no collected data.
In this topic: