Last Updated: June 21, 2024
Usage Dashboard
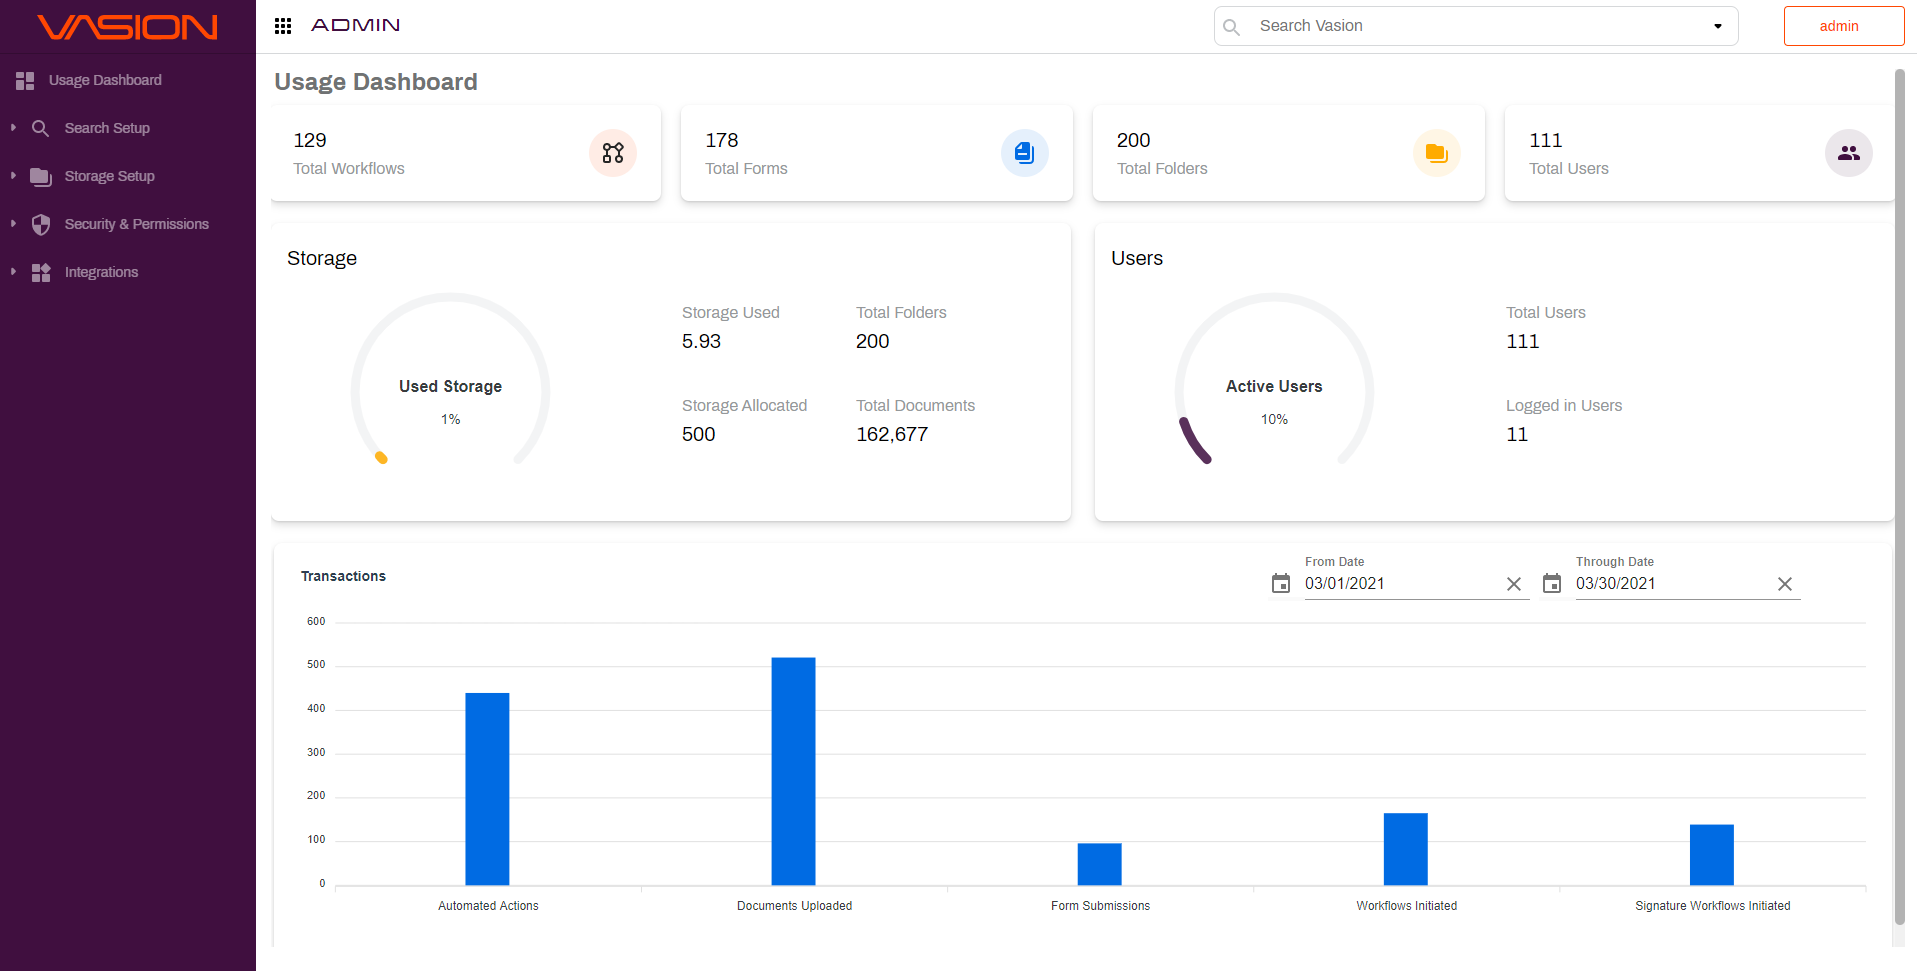
The Usage Dashboard is designed to give statistics on the use of Vasion. With these statistics you can find useful information on things such as how many workflows and forms have been created, total users and how many of them are active, storage used and allocated, and a graph that shows the number of transactions completed between customizable date ranges.
Accessing the Usage Dashboard
Access to the dashboard requires appropriate permissions.
-
Click the 9 dot app menu to show the Vasion Apps.
-
Click the Admin button.
-
Select Usage Dashboard.
Dashboard Statistics
- Total Workflows — This number represents the total number of active workflows in your application.
- Total Forms — This number represents the total number of active forms in your application.
- Total Folders — This number represents the total number of active folders in your application.
- Total Users — This number represents the total number of users in your application.
- Storage — These numbers represents the total number of storage space used and available in your application. The amounts represent GB. It also displays the total number of folders and total number of documents.
- Users — These numbers represent the total number of users, active users currently logged in, and those actively logged in users as a percentage.
- Transactions — The Transactions section allows you to quickly compile a graph showing the total transactions, categorically, based on a specific date range.